Our Research covers a broad spectrum of visual computing related to modeling, construction, representation, visualization and interaction techniques for multiscale dynamic molecular models of biological organisms and biotechnological structures. Our Technology will ultimately enable visual exploration and communication of virtual 3D representations of life forms integrating the most up-to-date knowledge from biological research.
Preprints
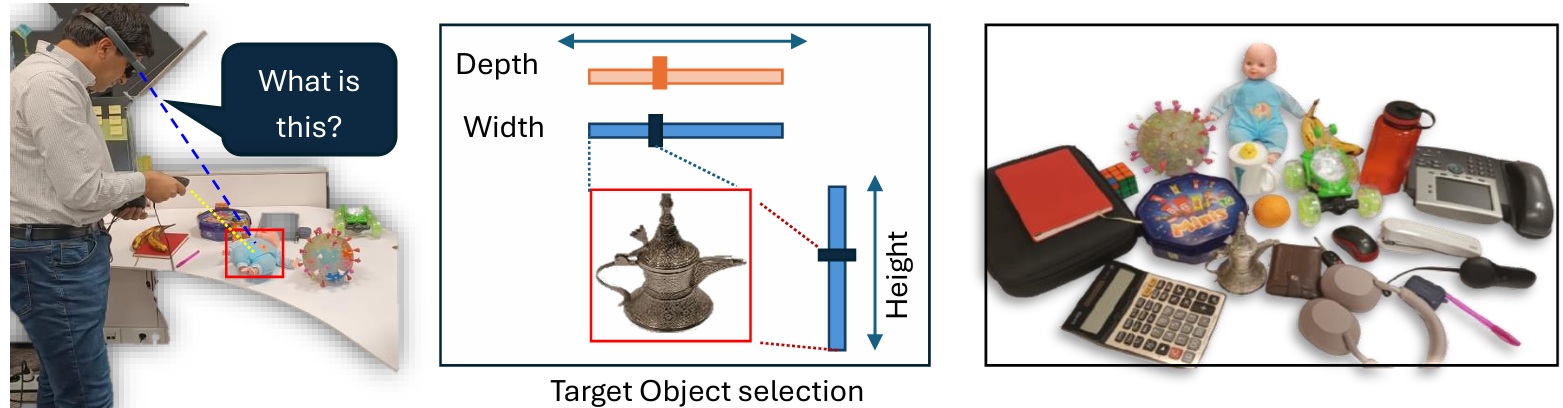
ClickAIXR: On-Device Multimodal Vision-Language Interaction with Real-World Objects in Extended Reality
arXiv preprint, https://arxiv.org/abs/2604.04905 , (2026)
ClickAIXR enables precise object-centered interaction in XR by combining controller-based selection with an on-device Vision-Language Model (VLM). It performs all inference locally, reducing latency and preserving privacy.
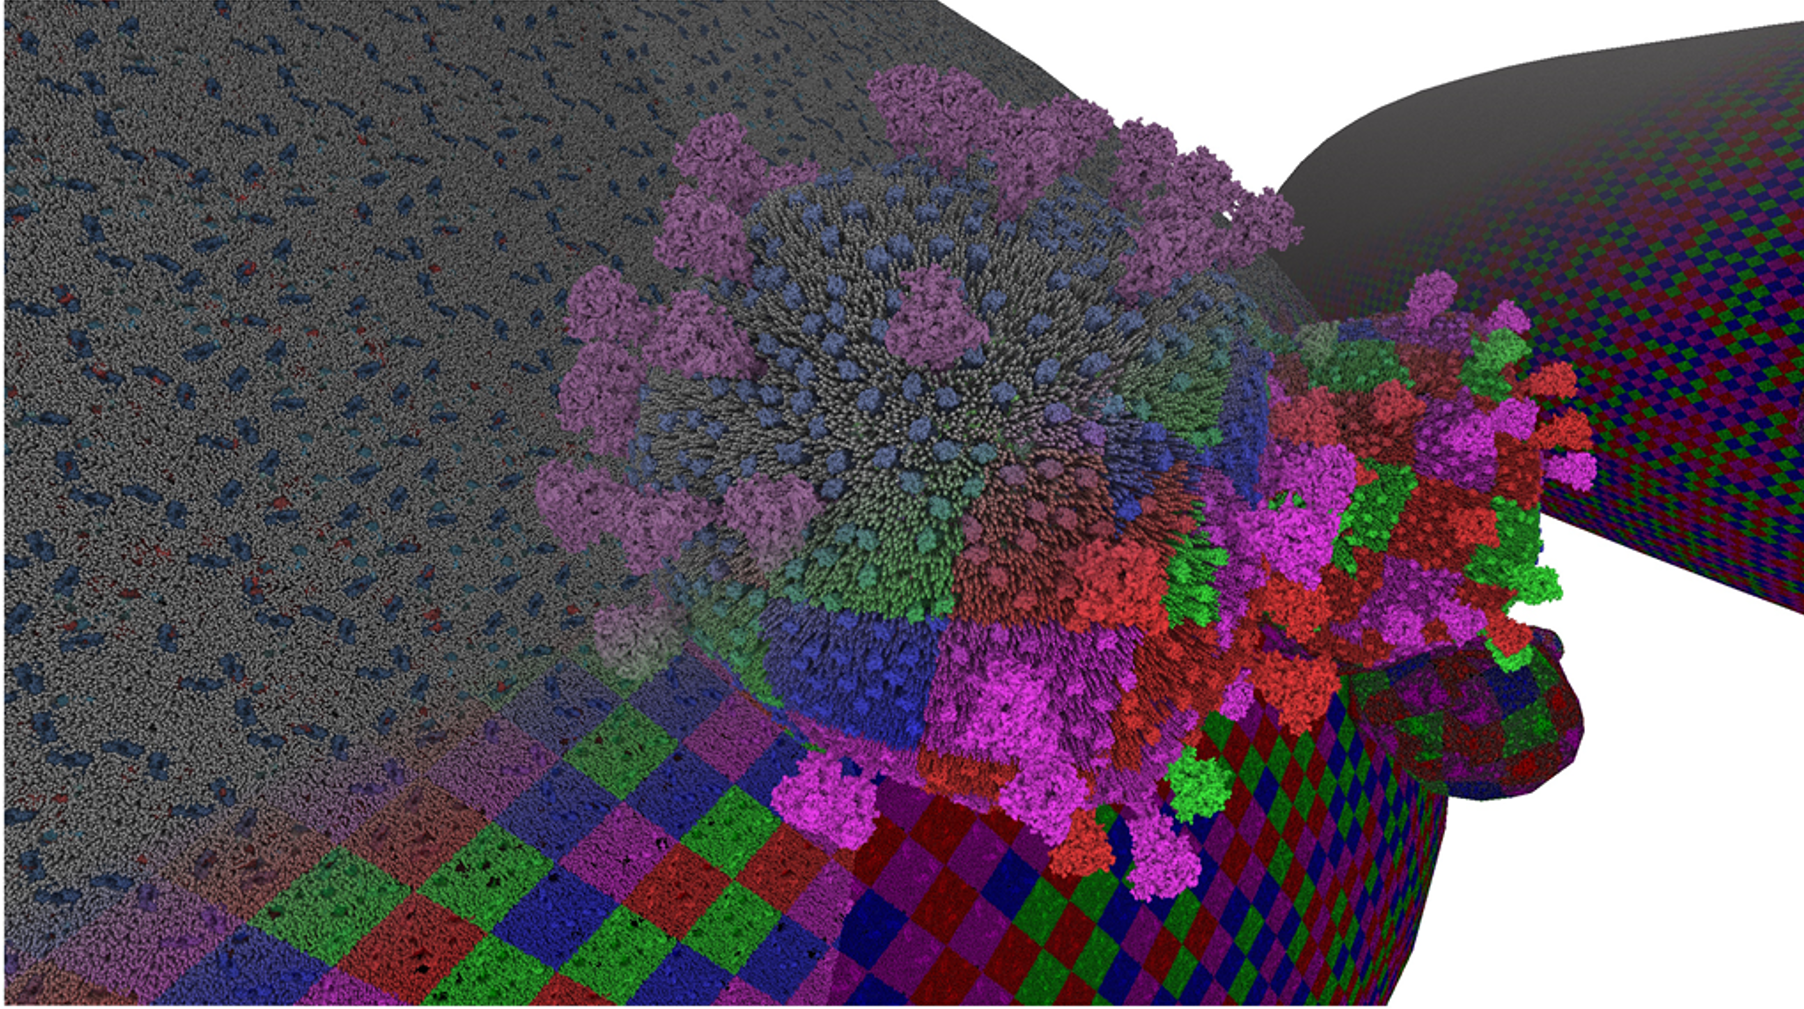
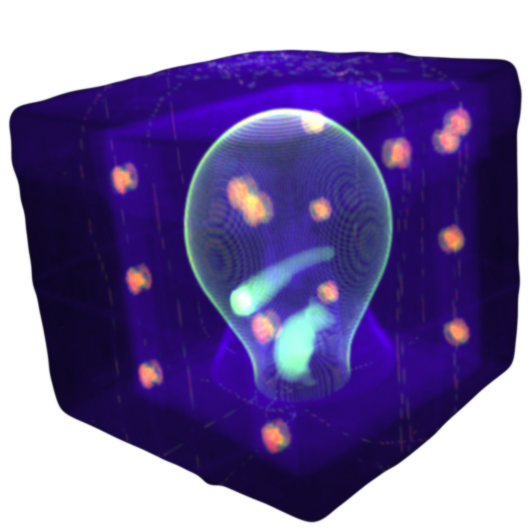
Nanouniverse: Virtual Instancing of Structural Detail and Adaptive Shell Mapping
arXiv preprint, https://arxiv.org/abs/2404.05116, (2024)
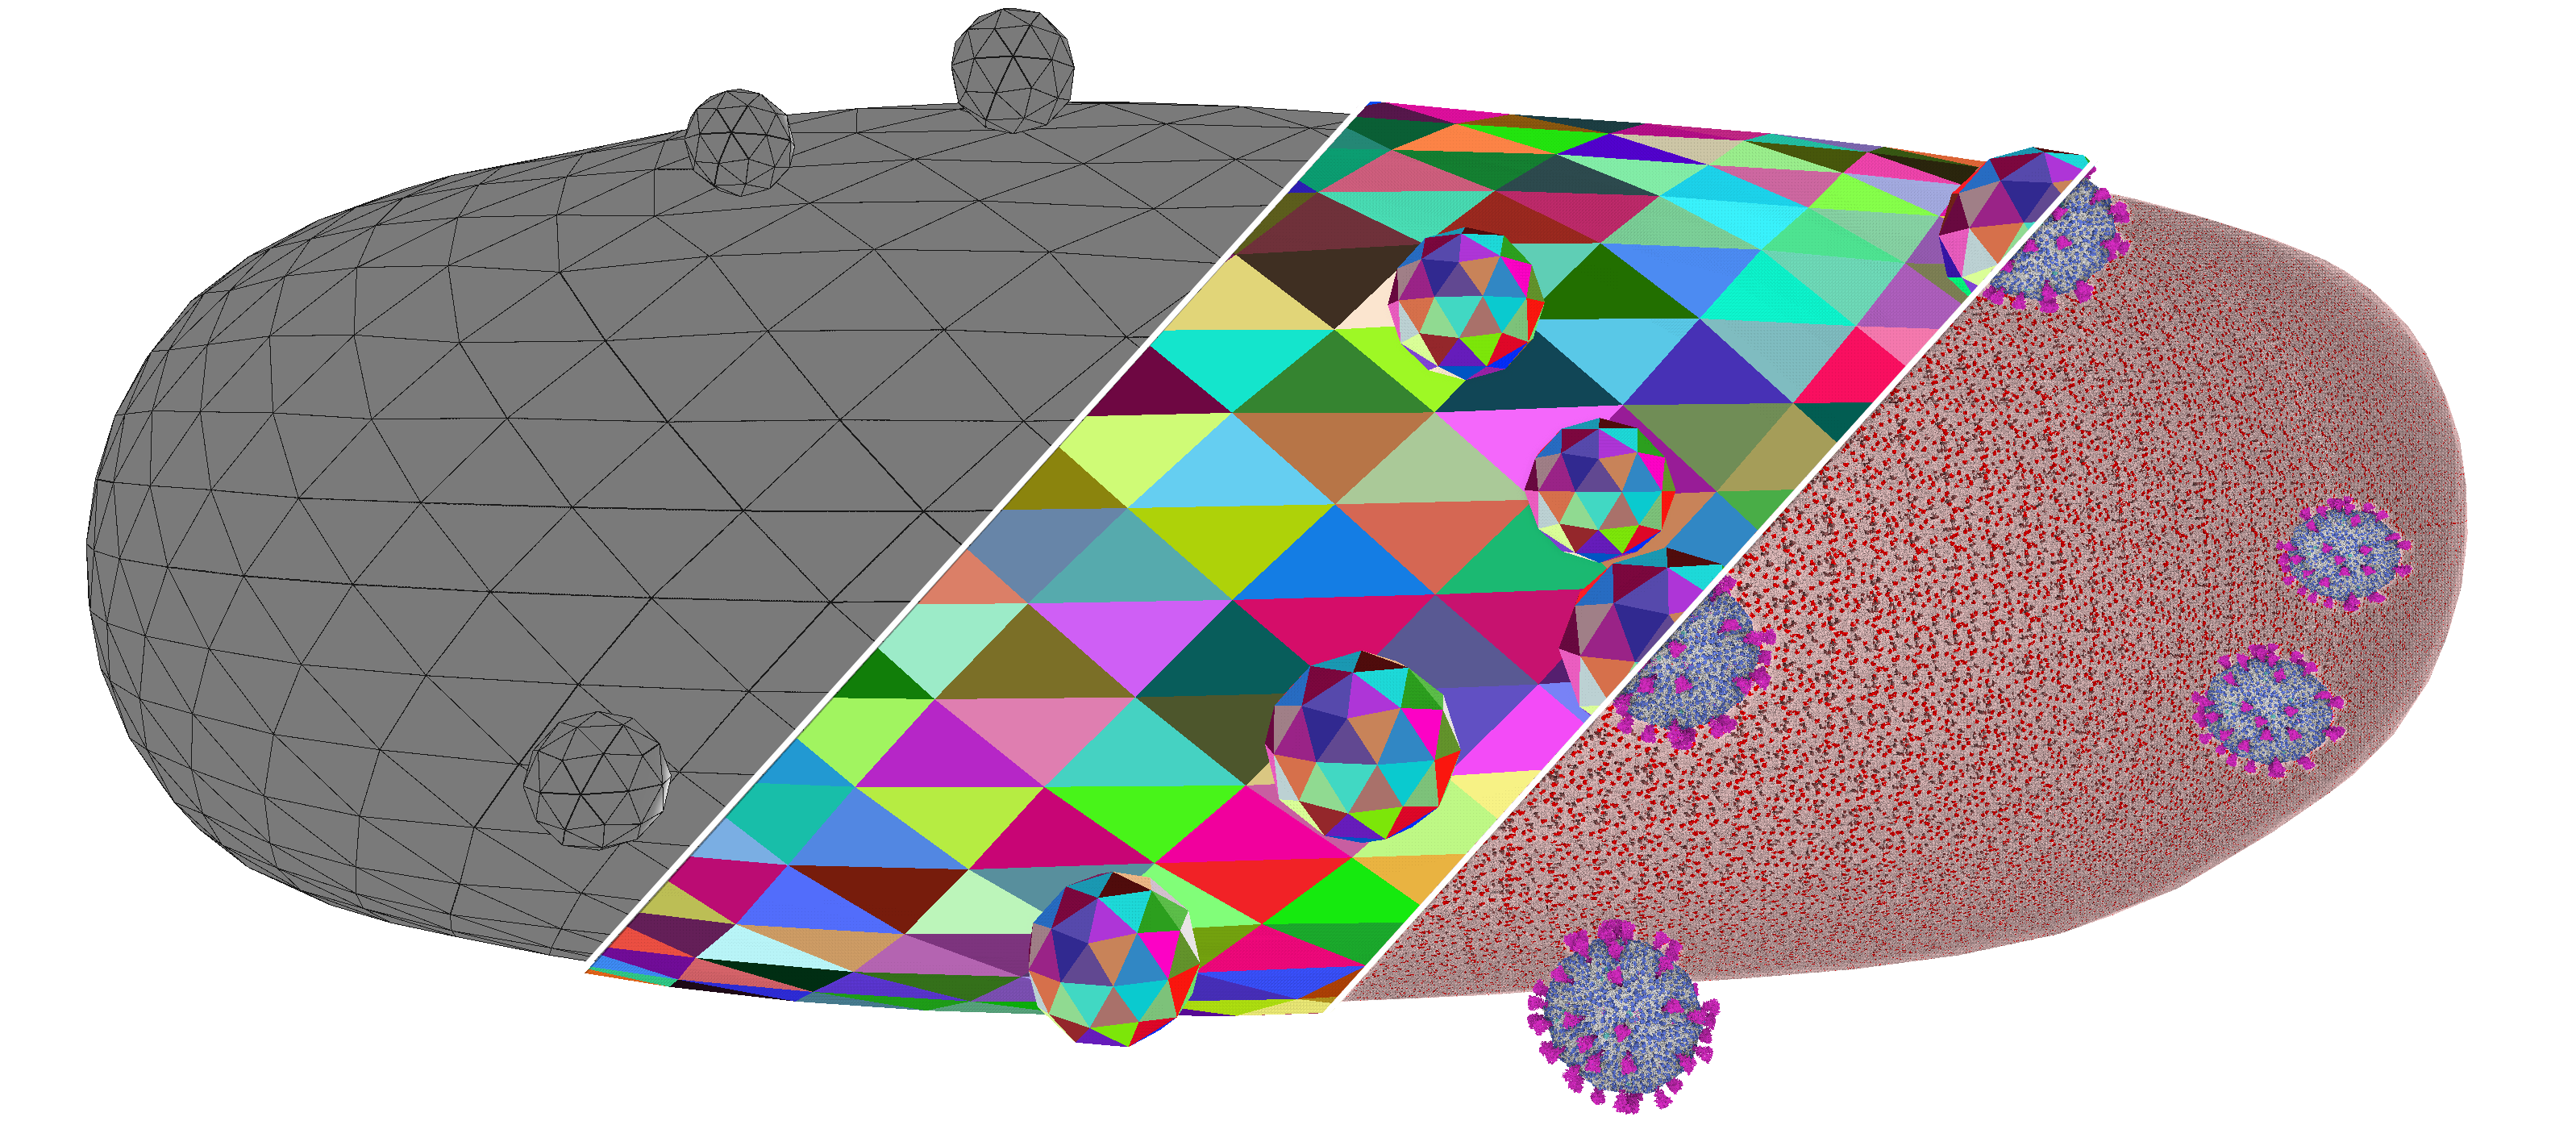
Nanouniverse introduces a novel method for rendering massive molecular scenes using hardware-accelerated ray tracing, overcoming GPU memory constraints with virtual instantiation. This approach reduces memory usage while maintaining atomistic detail in scenes with trillions of atoms, enabling interactive rendering and completely free user exploration.
Chat Modeling: Natural Language-based Procedural Modeling of Biological Structures without Training
arXiv preprint, arXiv:2404.01063, 2024
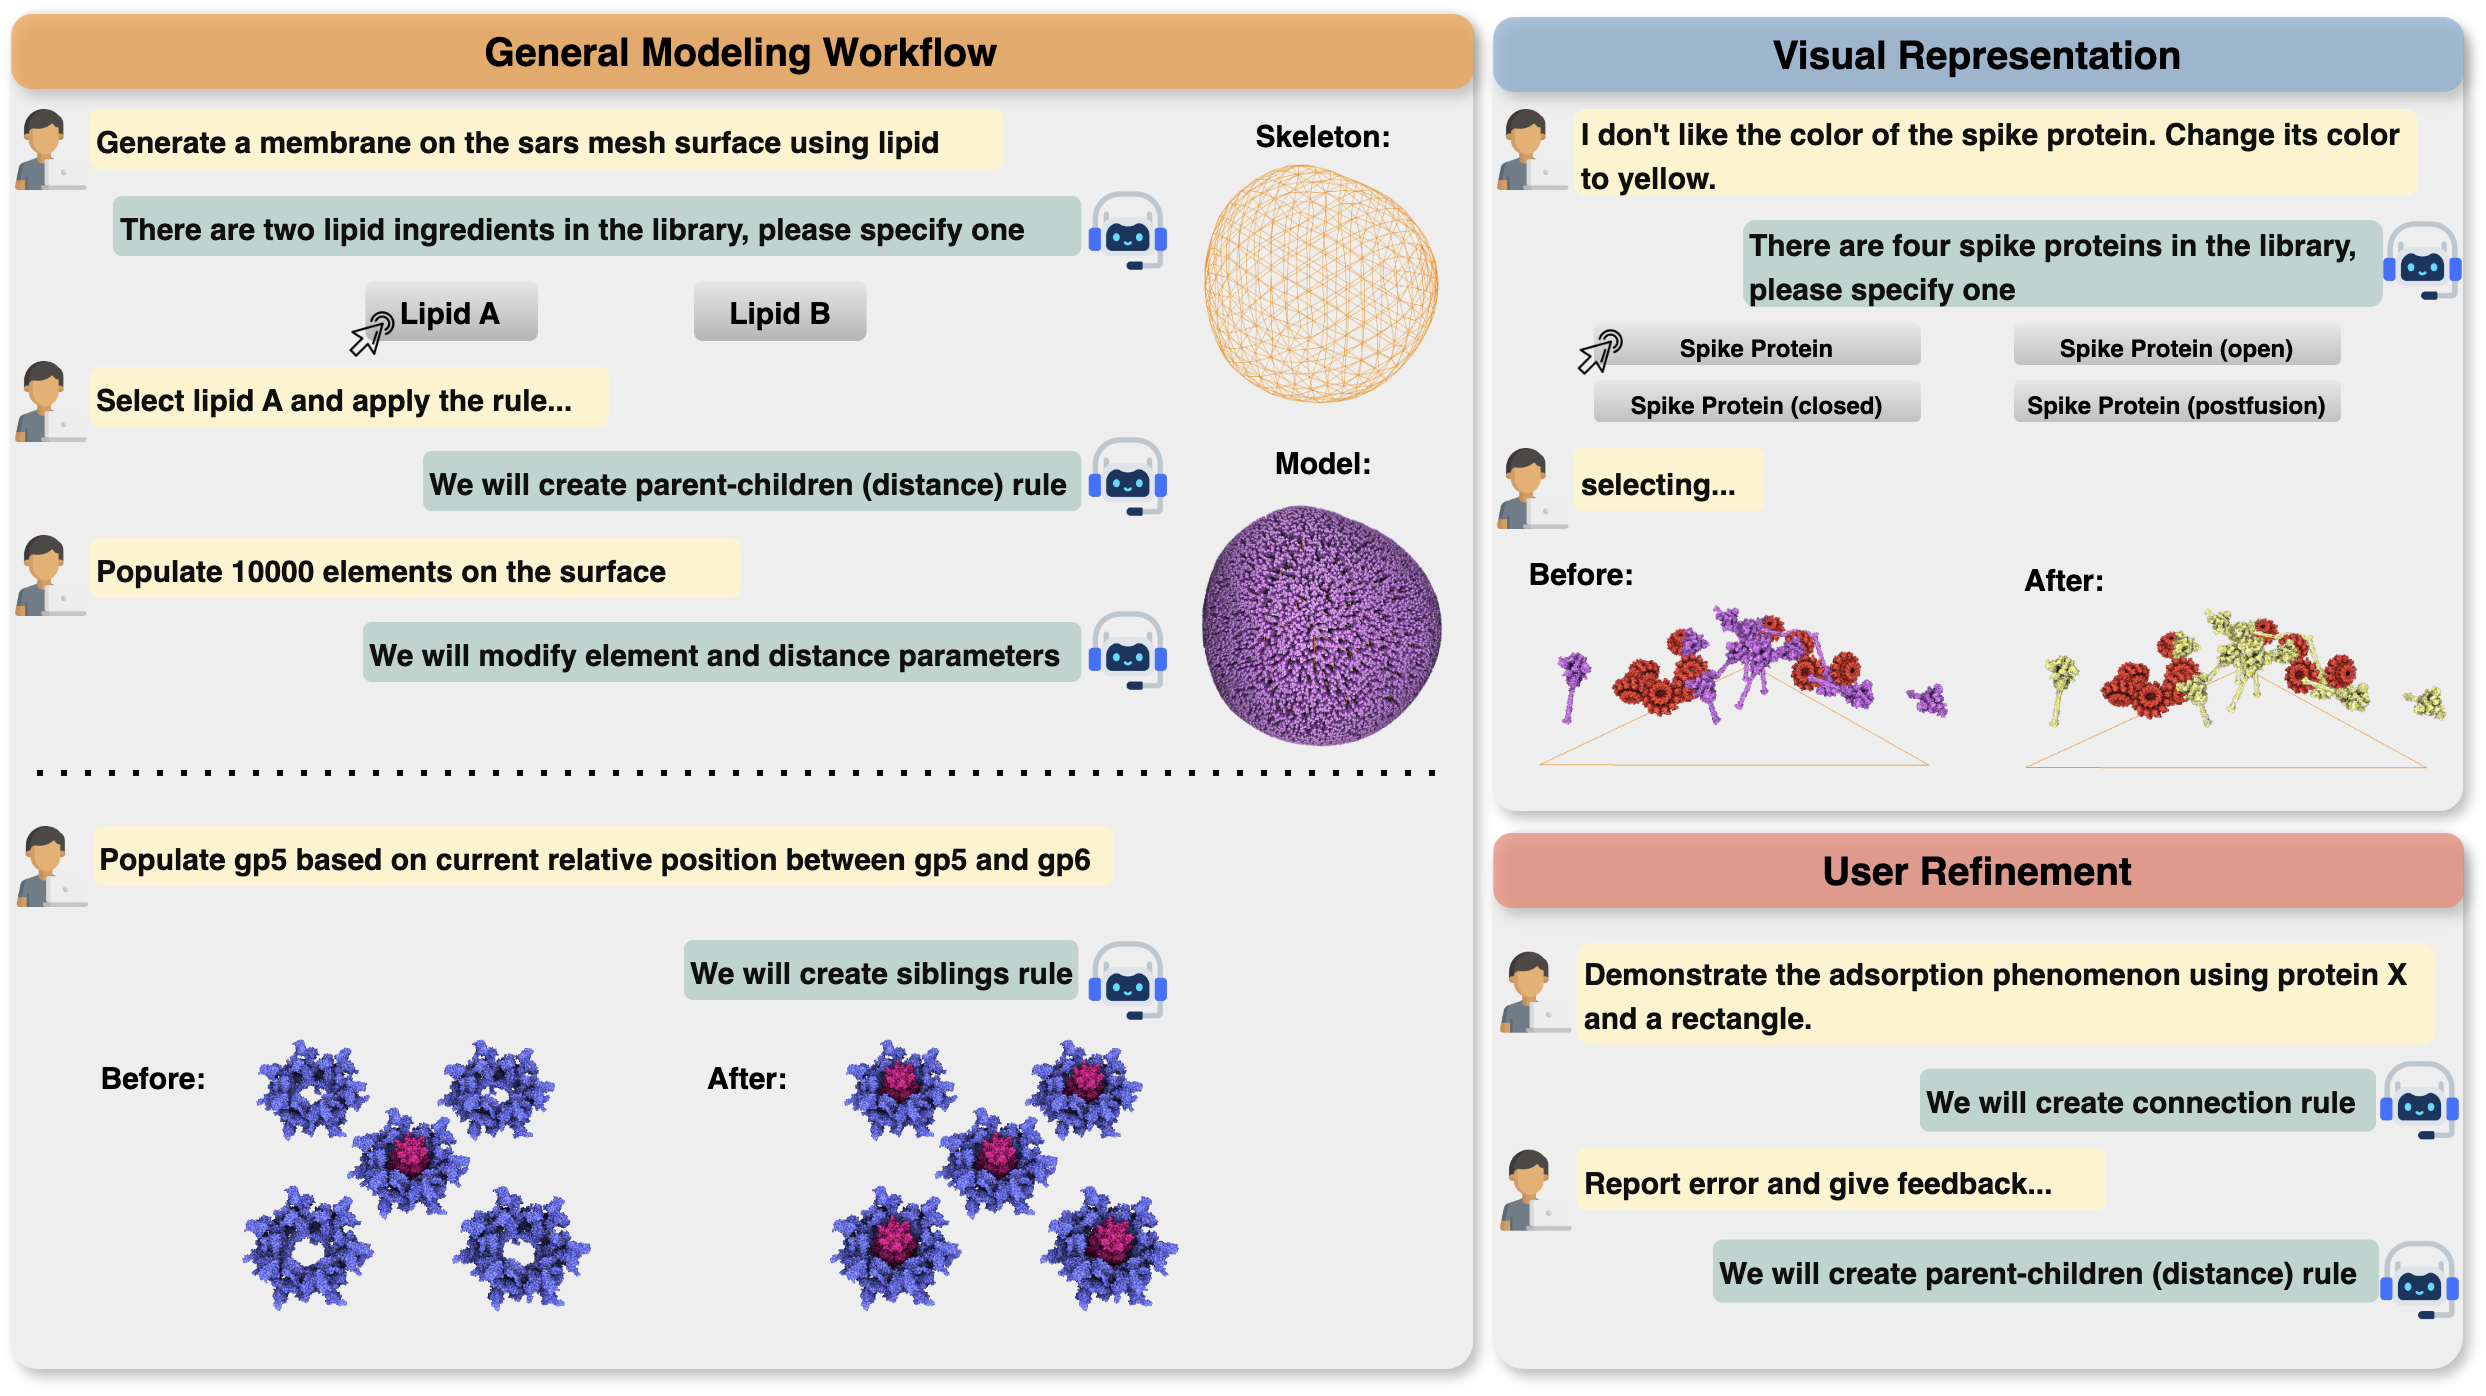
Chat Modeling is a natural language-based procedural modeling method that takes arbitrary textual input and completes corresponding 3D modeling tasks without any additional training.
Peer-reviewed Publications
2026
AIvaluateXR: An Evaluation Framework for On-Device AI in XR with Benchmarking Results
IEEE Transactions on Visualization and Computer Graphics (IEEE TVCG), 2026.
We present AIvaluateXR, a comprehensive evaluation framework for benchmarking large language models (LLMs) running on XR devices. To demonstrate the framework, we deploy 17 selected LLMs across four XR platforms—Magic Leap 2, Meta Quest 3, Vivo X100s Pro, and Apple Vision Pro—and conduct extensive evaluations of latency, memory usage, power consumption, and output quality.
2025
MidSurfer: A Parameter-Free Approach for Mid-Surface Extraction from Segmented Volumetric Data
IEEE Computer Graphics and Applications (CG&A), vol. 45, no. 1, pp. 1–14, Oct. 2025. DOI: 10.1109/MCG.2025.3624572
MidSurfer introduces a novel, parameter-free method for extracting mid-surfaces from segmented volumetric data.
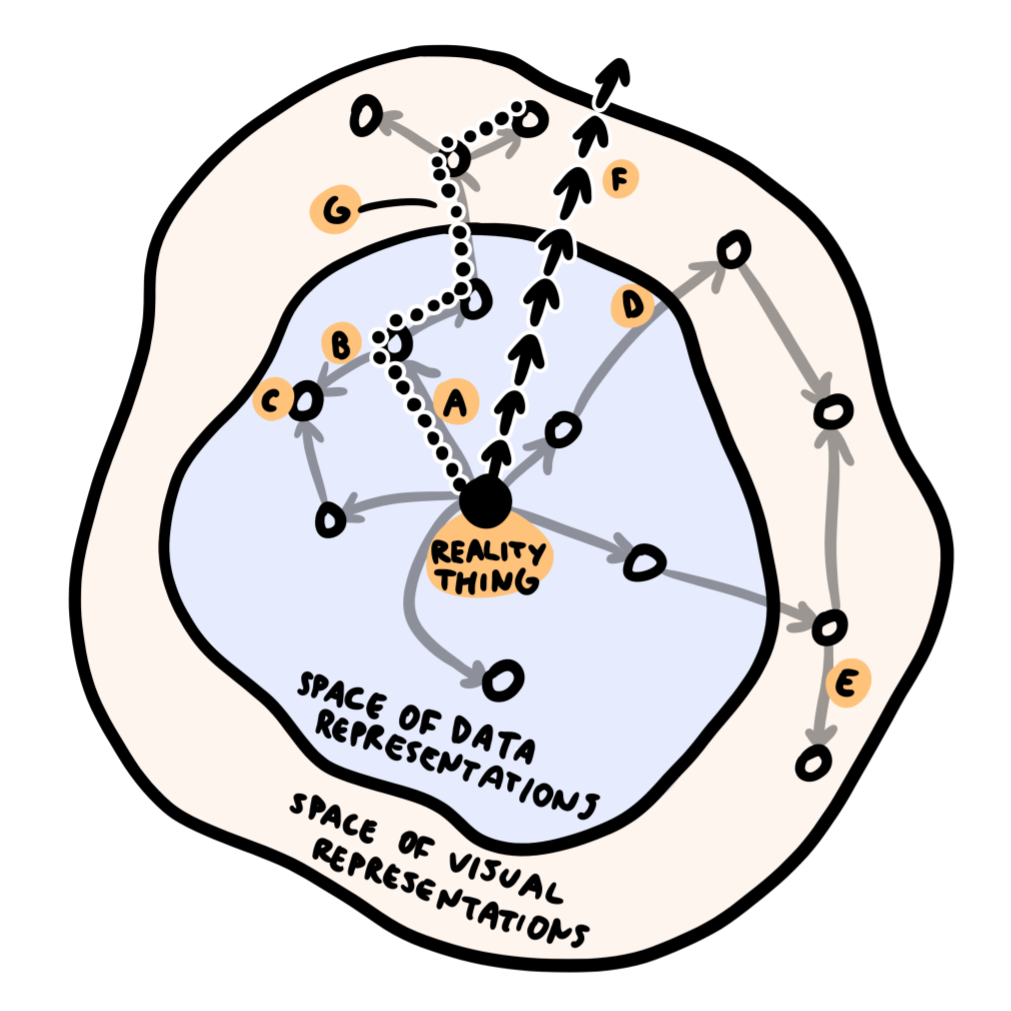
VOICE: Visual Oracle for Interaction, Conversation, and Explanation
IEEE Transactions on Visualization and Computer Graphics (TVCG), 2025.
DOI: 10.1109/TVCG.2025.3579956
We present VOICE, a novel approach to science communication that connects the conversational capabilities of large language models with interactive exploratory visualization.
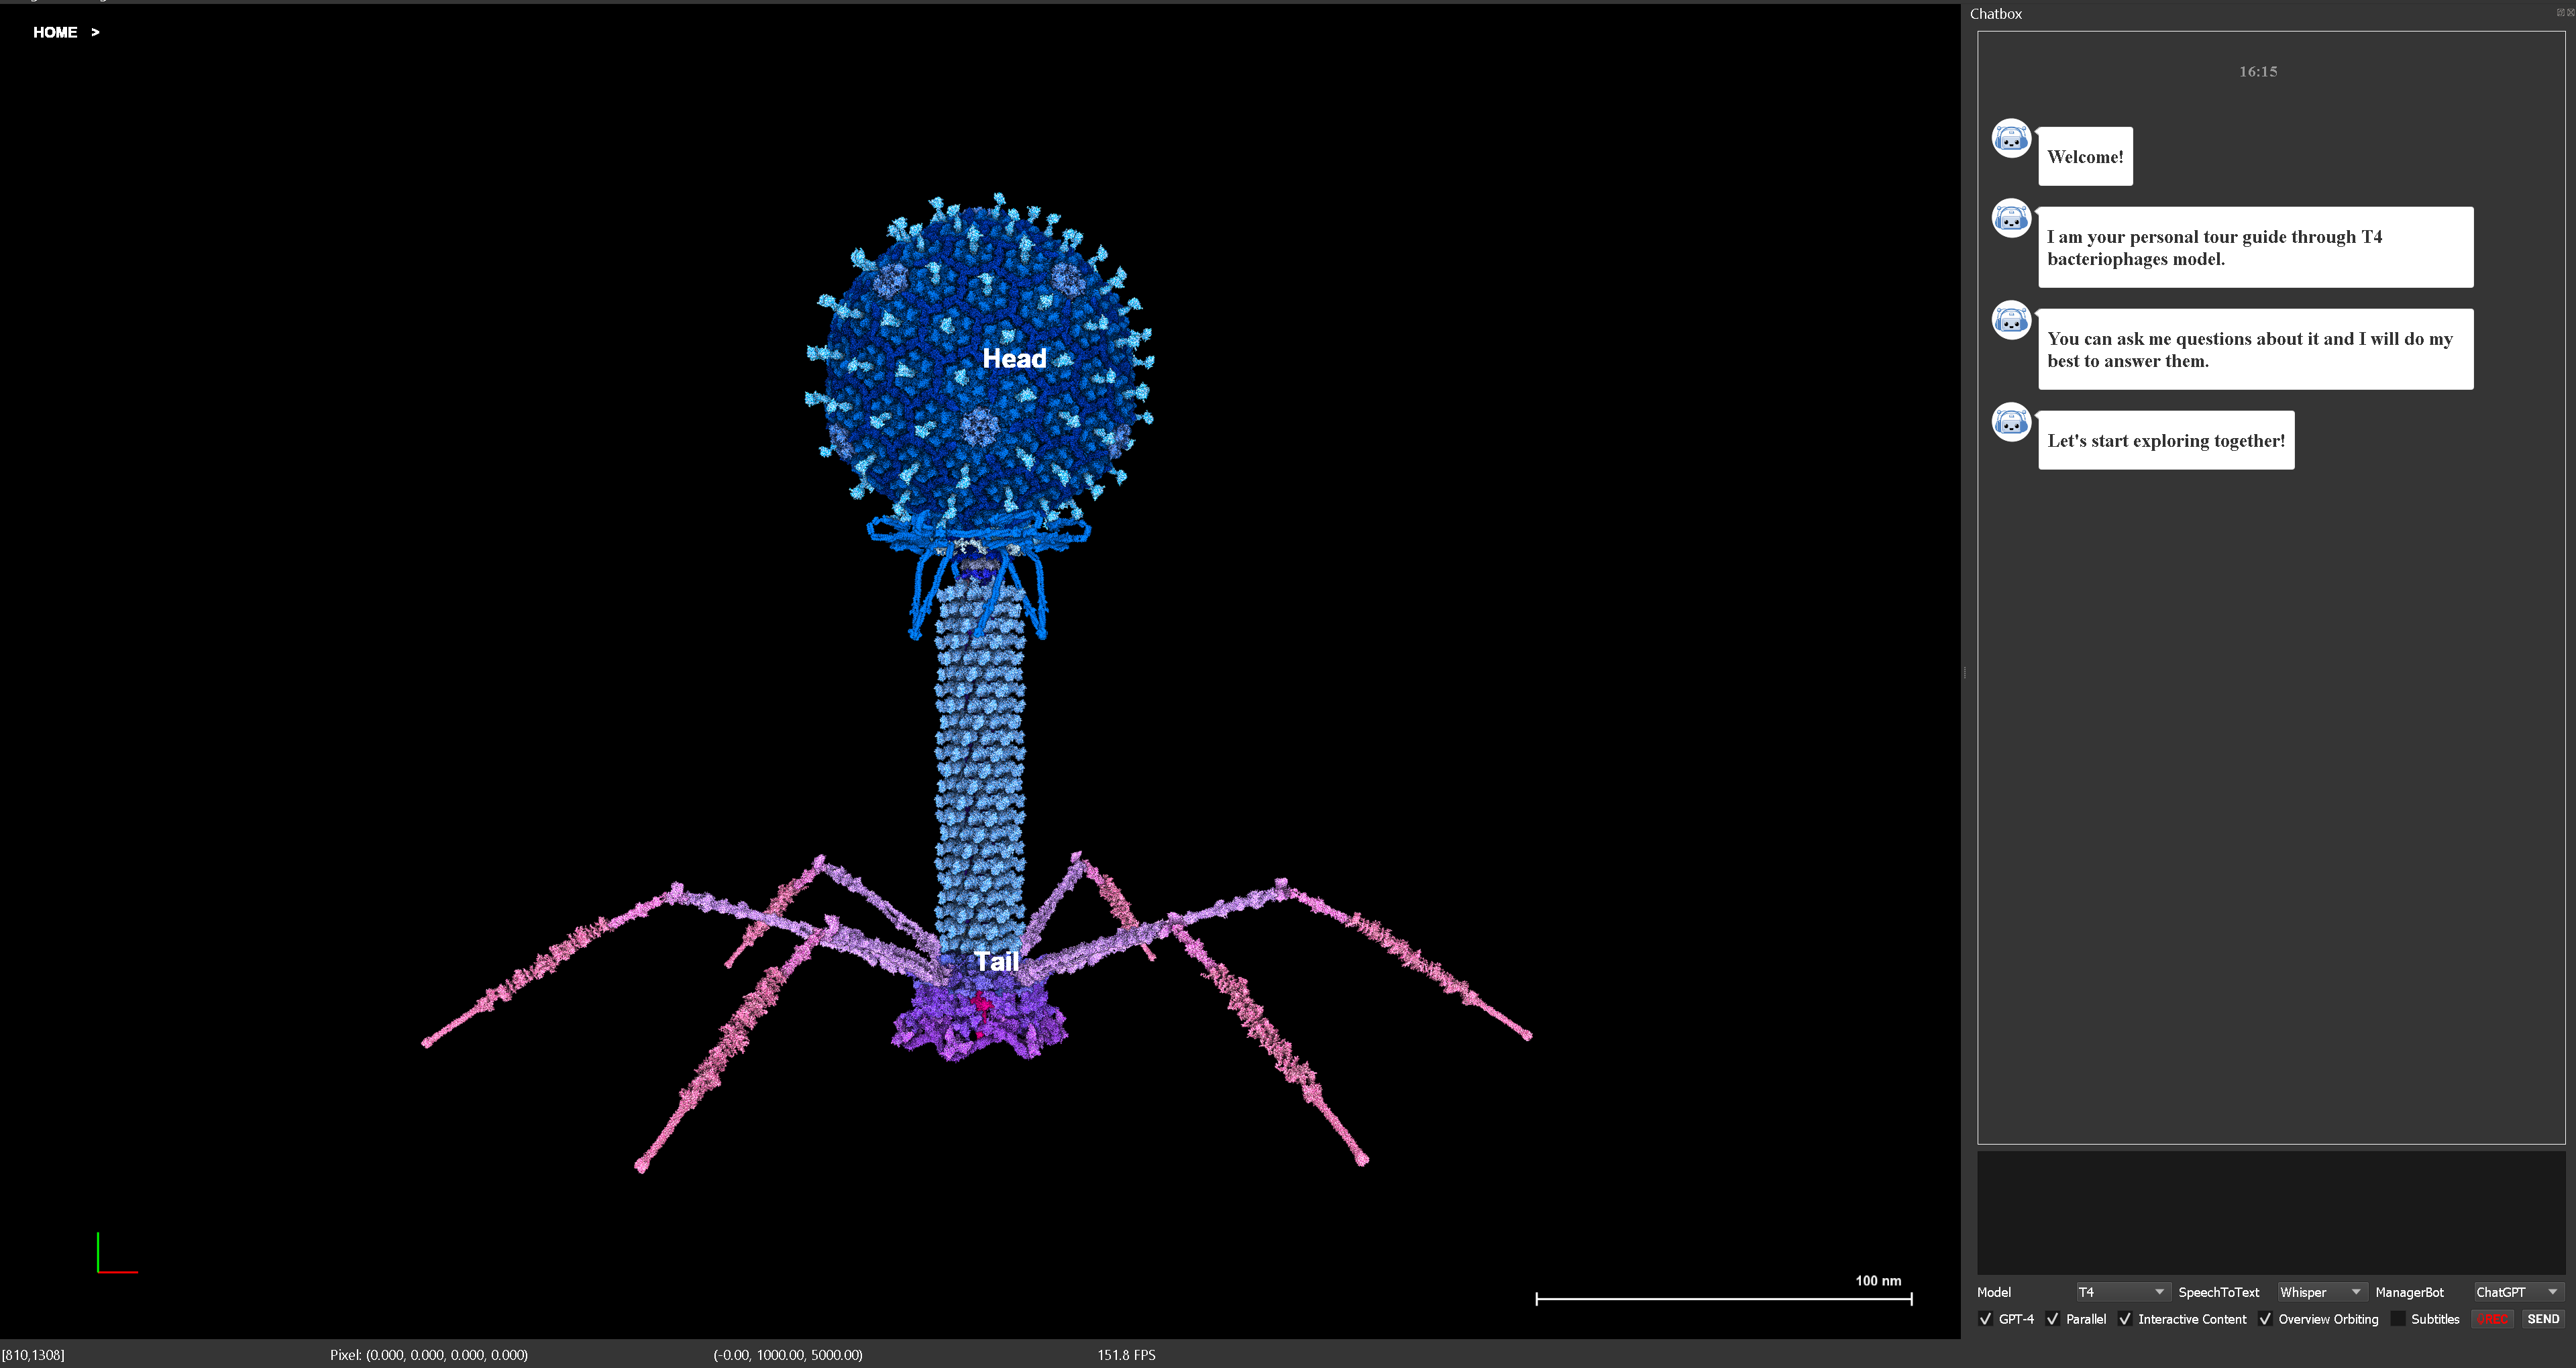
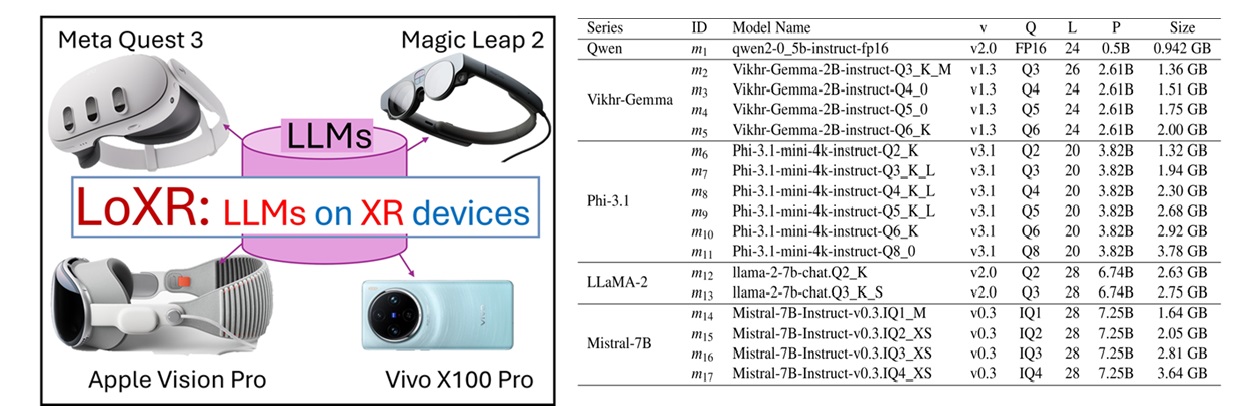
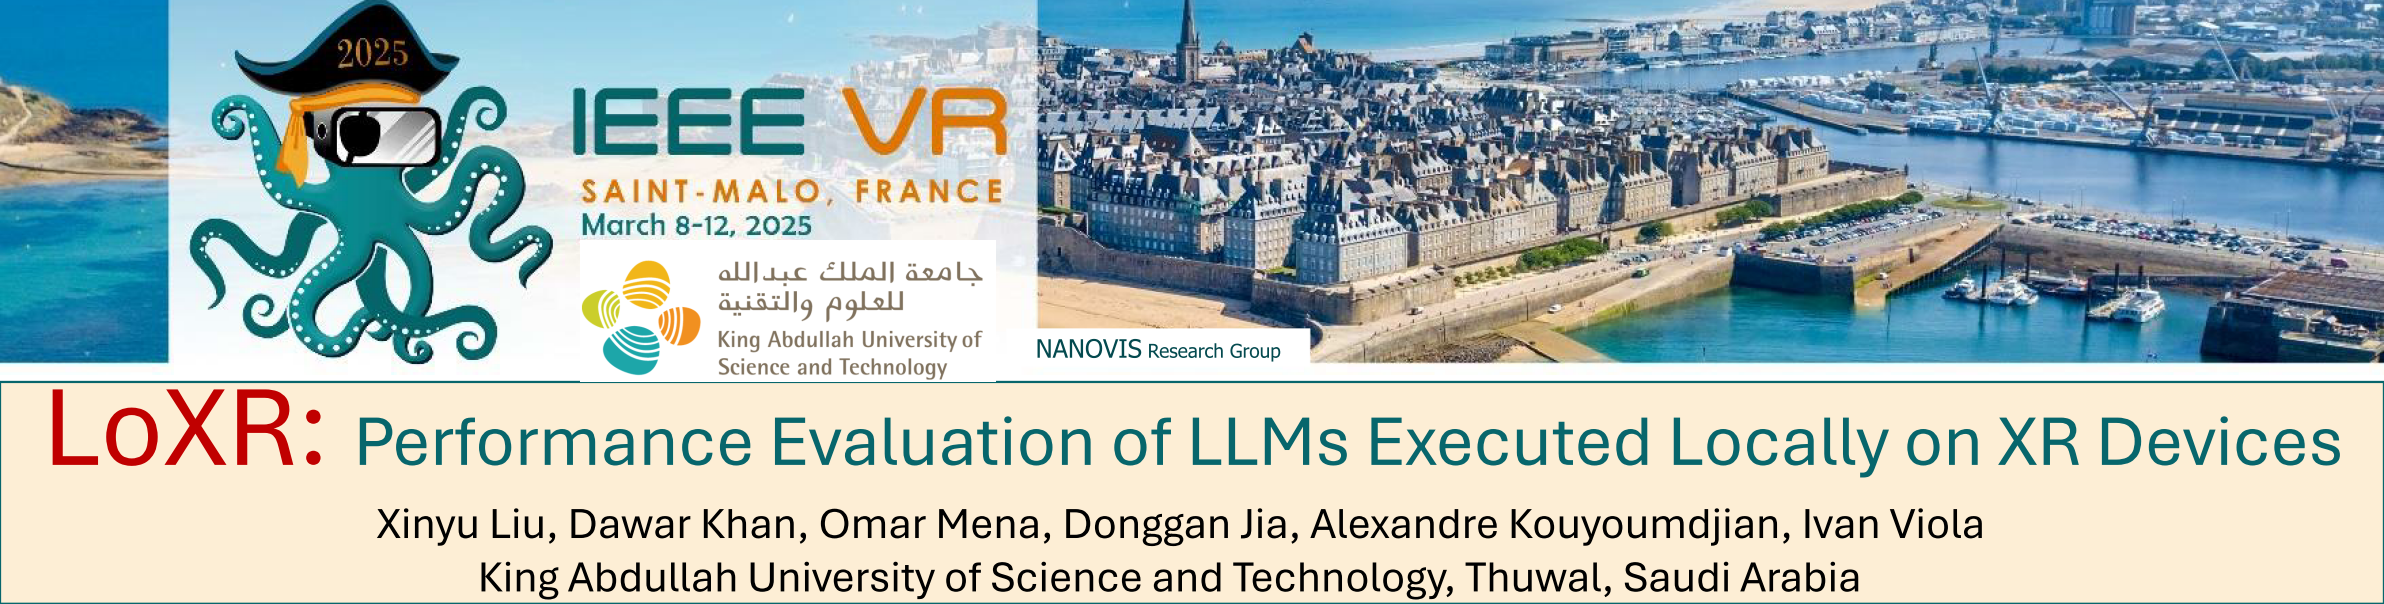
LLMs on XR (LoXR): Performance Evaluation of LLMs Executed Locally on XR Devices
Xinyu Liu, Dawar Khan, Omar Mena, Donggang Jia, Alexandre Kouyoumdjian, Ivan Viola
IEEE Conference on Virtual Reality and 3D User Interfaces Abstracts and Workshops (VRW), DOI: 10.1109/VRW66409.2025.00252
This paper presents LoXR, a performance evaluation of Large Language Models (LLMs) executed locally on XR devices. More about LoXR ...
2024
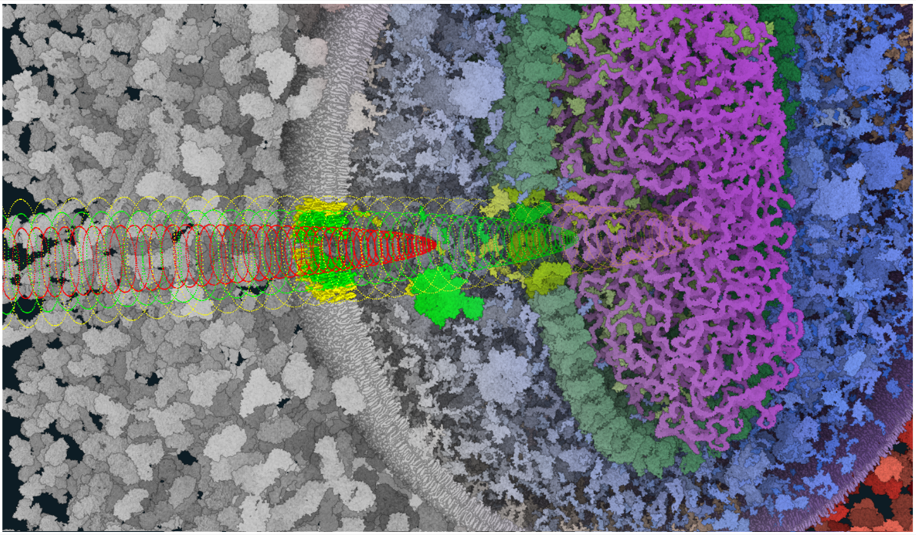
Nanomatrix: Scalable Construction of Crowded Biological Environments
IEEE Transactions on Visualization and Computer Graphics, 2024
We present a novel method for the interactive construction and rendering of extremely large molecular scenes, capable of representing multiple biological cells in atomistic detail. Our approach leverages an on-demand, view-dependent procedural generation strategy to overcome memory limitations and achieve high-resolution rendering of scenes containing trillions of atoms.
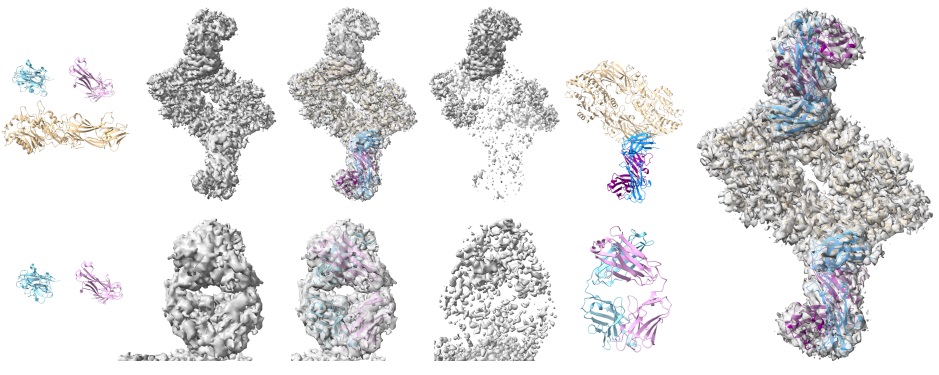
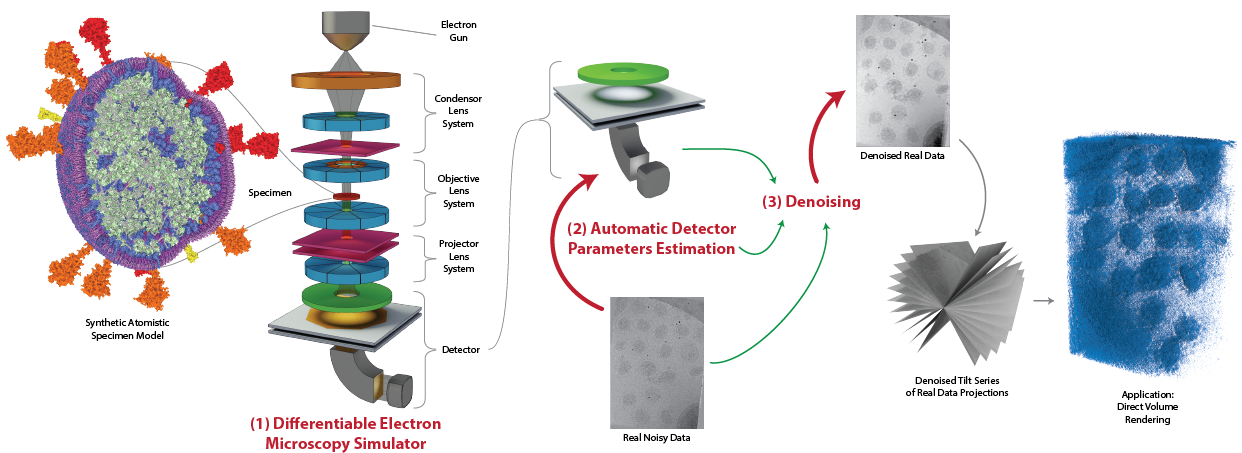
Towards Differentiable Electron Microscopy Simulation: Methods and Applications
IEEE 16th Pacific Visualization Symposium (PacificVis), 2024
We present a new differentiable microscopy simulation system that allows us to generate cryo-EM micrographs of complex scenes of biological structures, and to solve inverse problems through optimization, such as estimation of microscope parameters and denoising.
2023
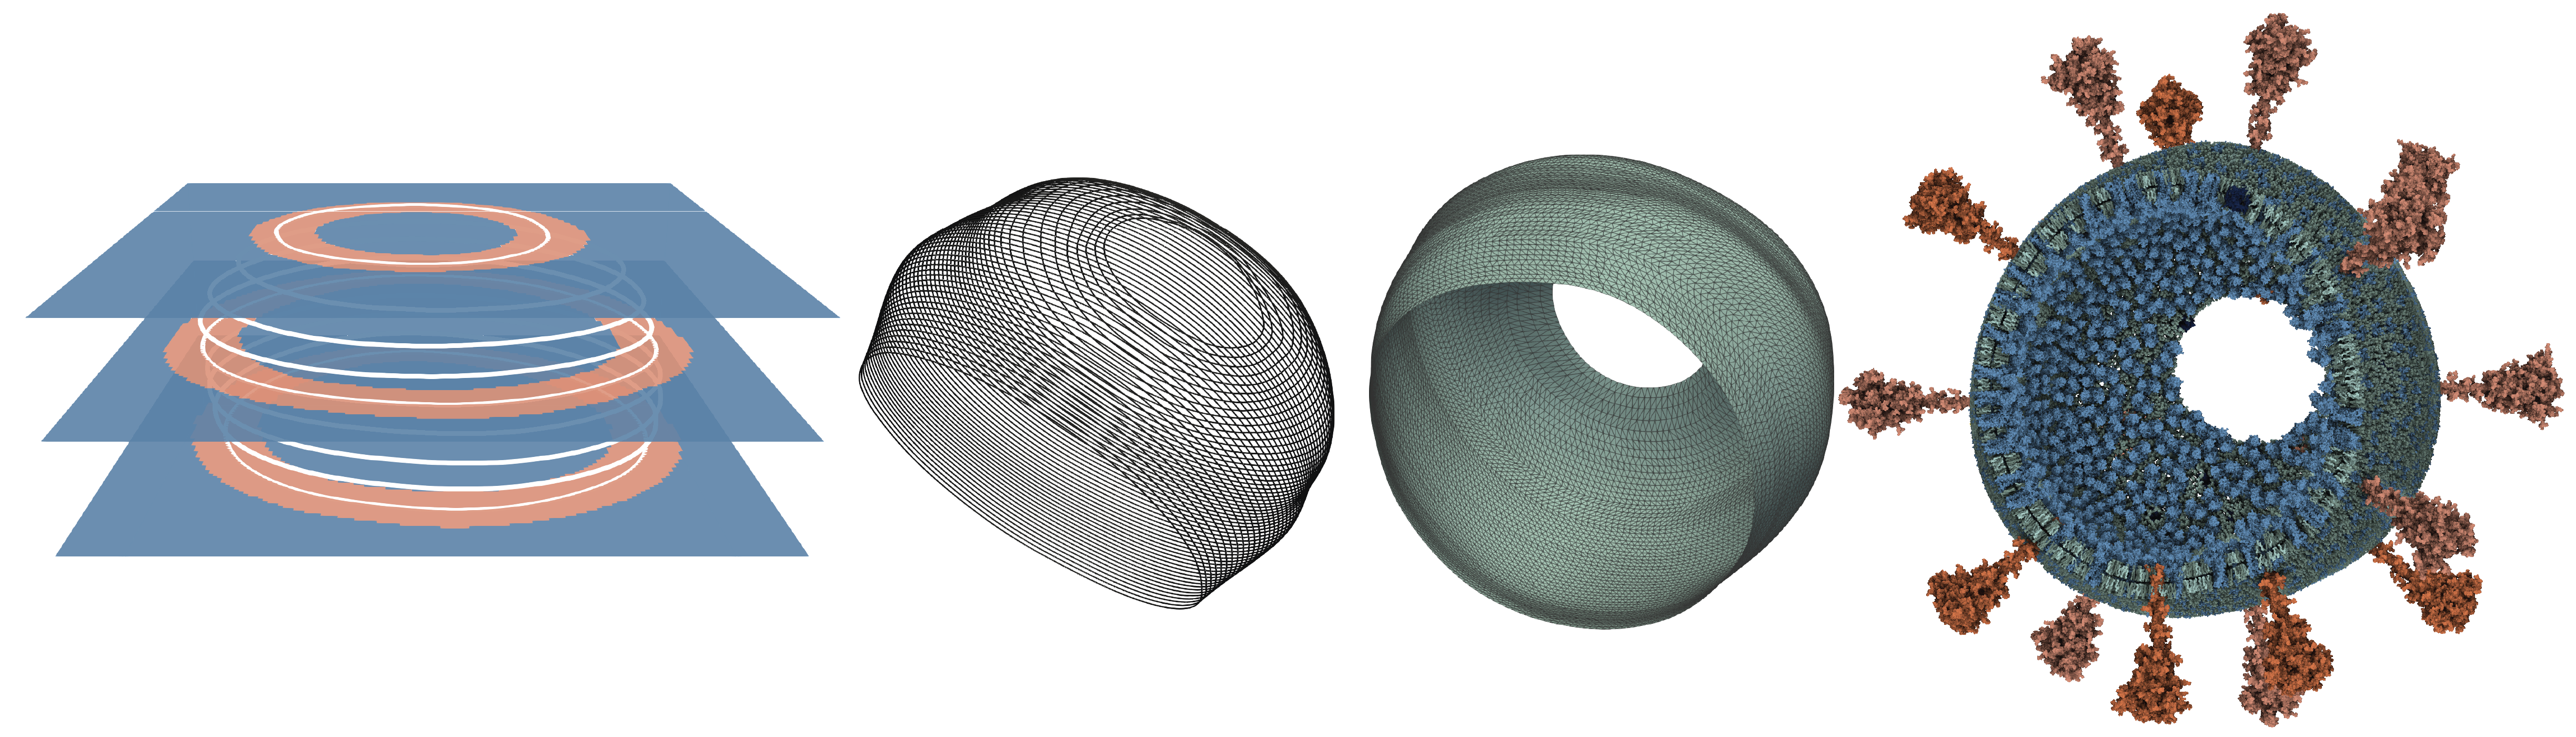
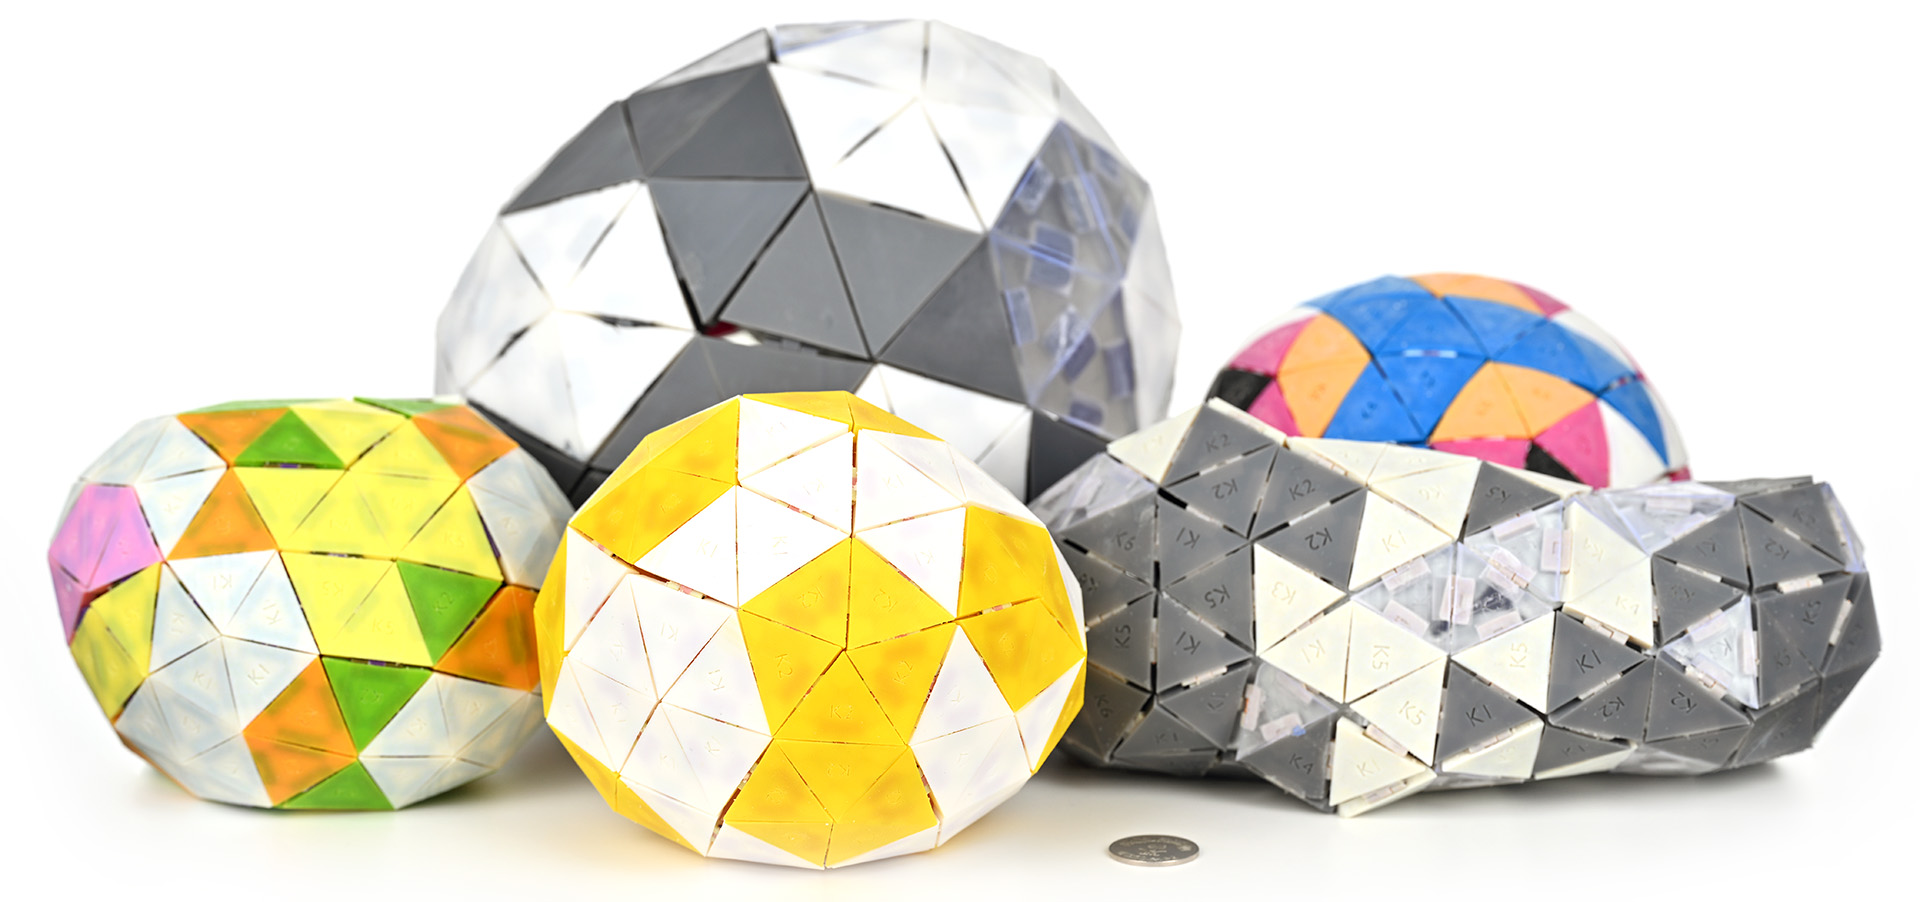
Dr. KID: Direct Remeshing and K-set Isometric Decomposition for Scalable Physicalization of Organic Shapes
IEEE Transactions on Visualization and Computer Graphics, (IEEE VIS2023 Honorable Mention).
Dr. KID is an algorithm that uses isometric decomposition for the physicalization of potato-shaped organic models in a puzzle fashion.
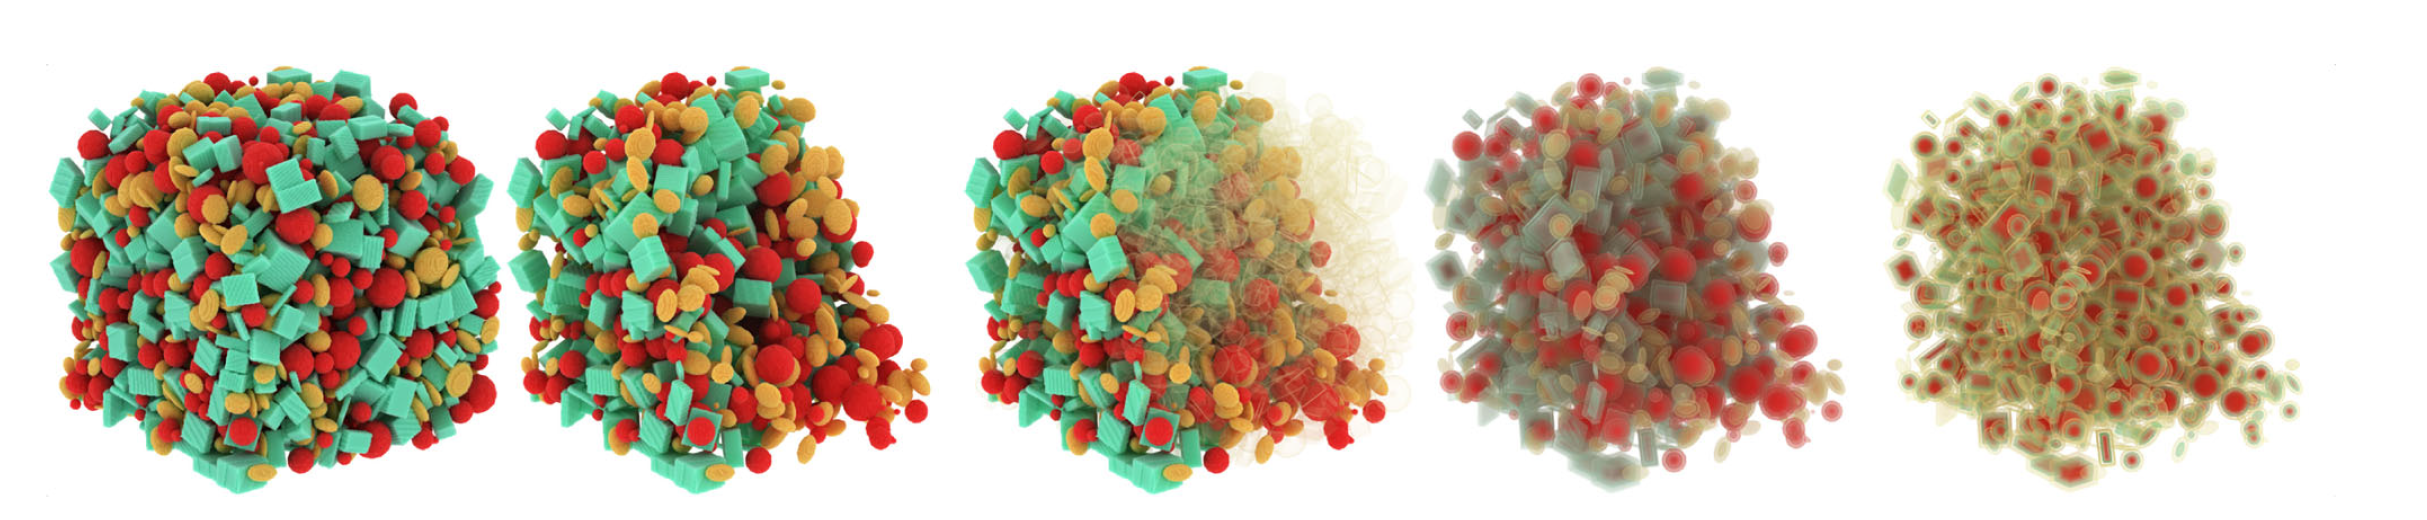
Volume conductor: interactive visibility management for crowded volumes
The visual computer, 2023.
We present a smart visibility system that enables per-instance control of object visibility in crowded volumetric data, improving exploration by grouping objects and automatically sparsifying dense volumes based on membership predicates and view context.
2022
GPU Accelerated 3D Tomographic Reconstruction and Visualization from Noisy Electron Microscopy Tilt-Series
We present a novel framework for 3D tomographic reconstruction and visualization of tomograms from noisy electron microscopy tilt-series.
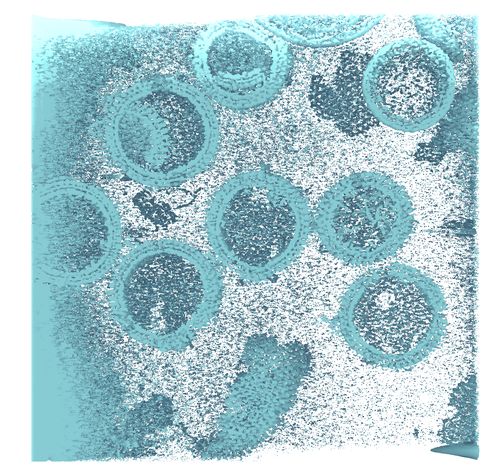
Finding Nano-Ötzi: Cryo-Electron Tomography Visualization Guided by Learned Segmentation
A semi-supervised approach combining the advantages of a weak segmentation algorithm and a powerful deep-learning-based segmentation algorithm for the segmentation of Cryo-Electron data which is used in the proposed volume visualization where deep-learning-based segmentation is used as a component for segmentation-aware transfer function design.
2021
Nanotilus: Generator of Immersive Guided-Tours in Crowded 3D Environments
Nanotilus is a guided-tour generator for immersive display environments to communicate multi-scale, crowded, scientifically accurate 3D models representing the structure of complex biological entities.
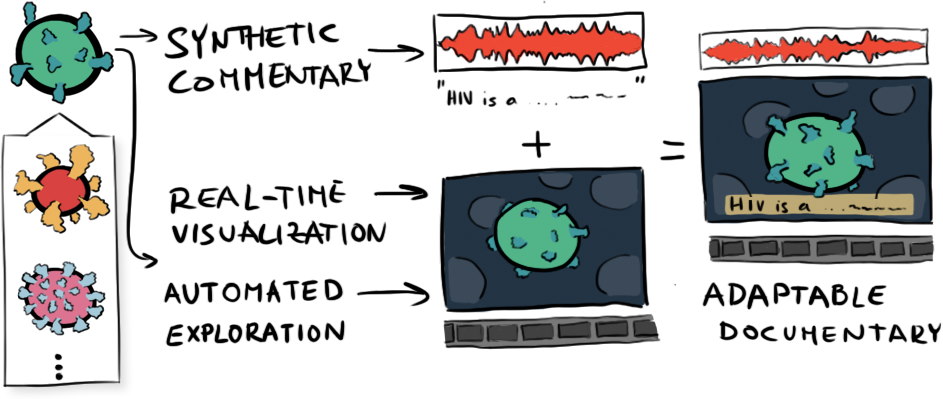
Molecumentary: Adaptable Narrated Documentaries Using Molecular Visualization
Molecumentary is a method for producing documentary-style content using real-time scientific visualization.
Data-driven Colormap Adjustment for Exploring Spatial Variations in Scalar Fields
A colormap adjustment as an objective function, composed of a boundary term and a fidelity term, which is flexible enough to support interactive functionalities.
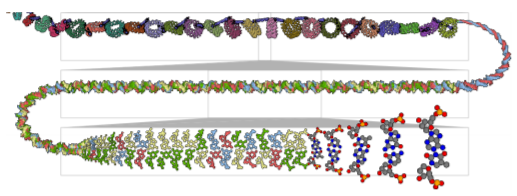
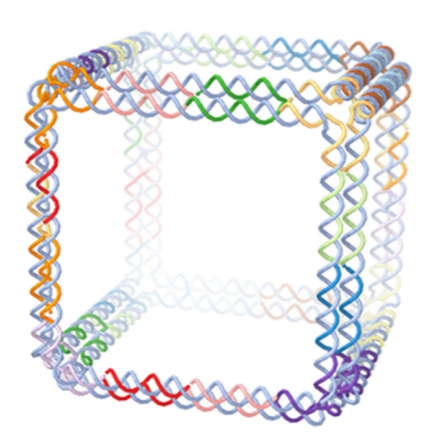
Multiscale Unfolding: Illustratively Visualizing the Whole Genome at a Glance
Multiscale Unfolding, an interactive technique for illustratively visualizing multiple hierarchical scales of DNA in a single view, showing the genome at different scales and demonstrating how one scale spatially folds into the next.
2020
Multi-level Area Balancing of Clustered Graphs
We present a multi-level area balancing technique for laying out clustered graphs to facilitate a comprehensive understanding of the complex relationships...
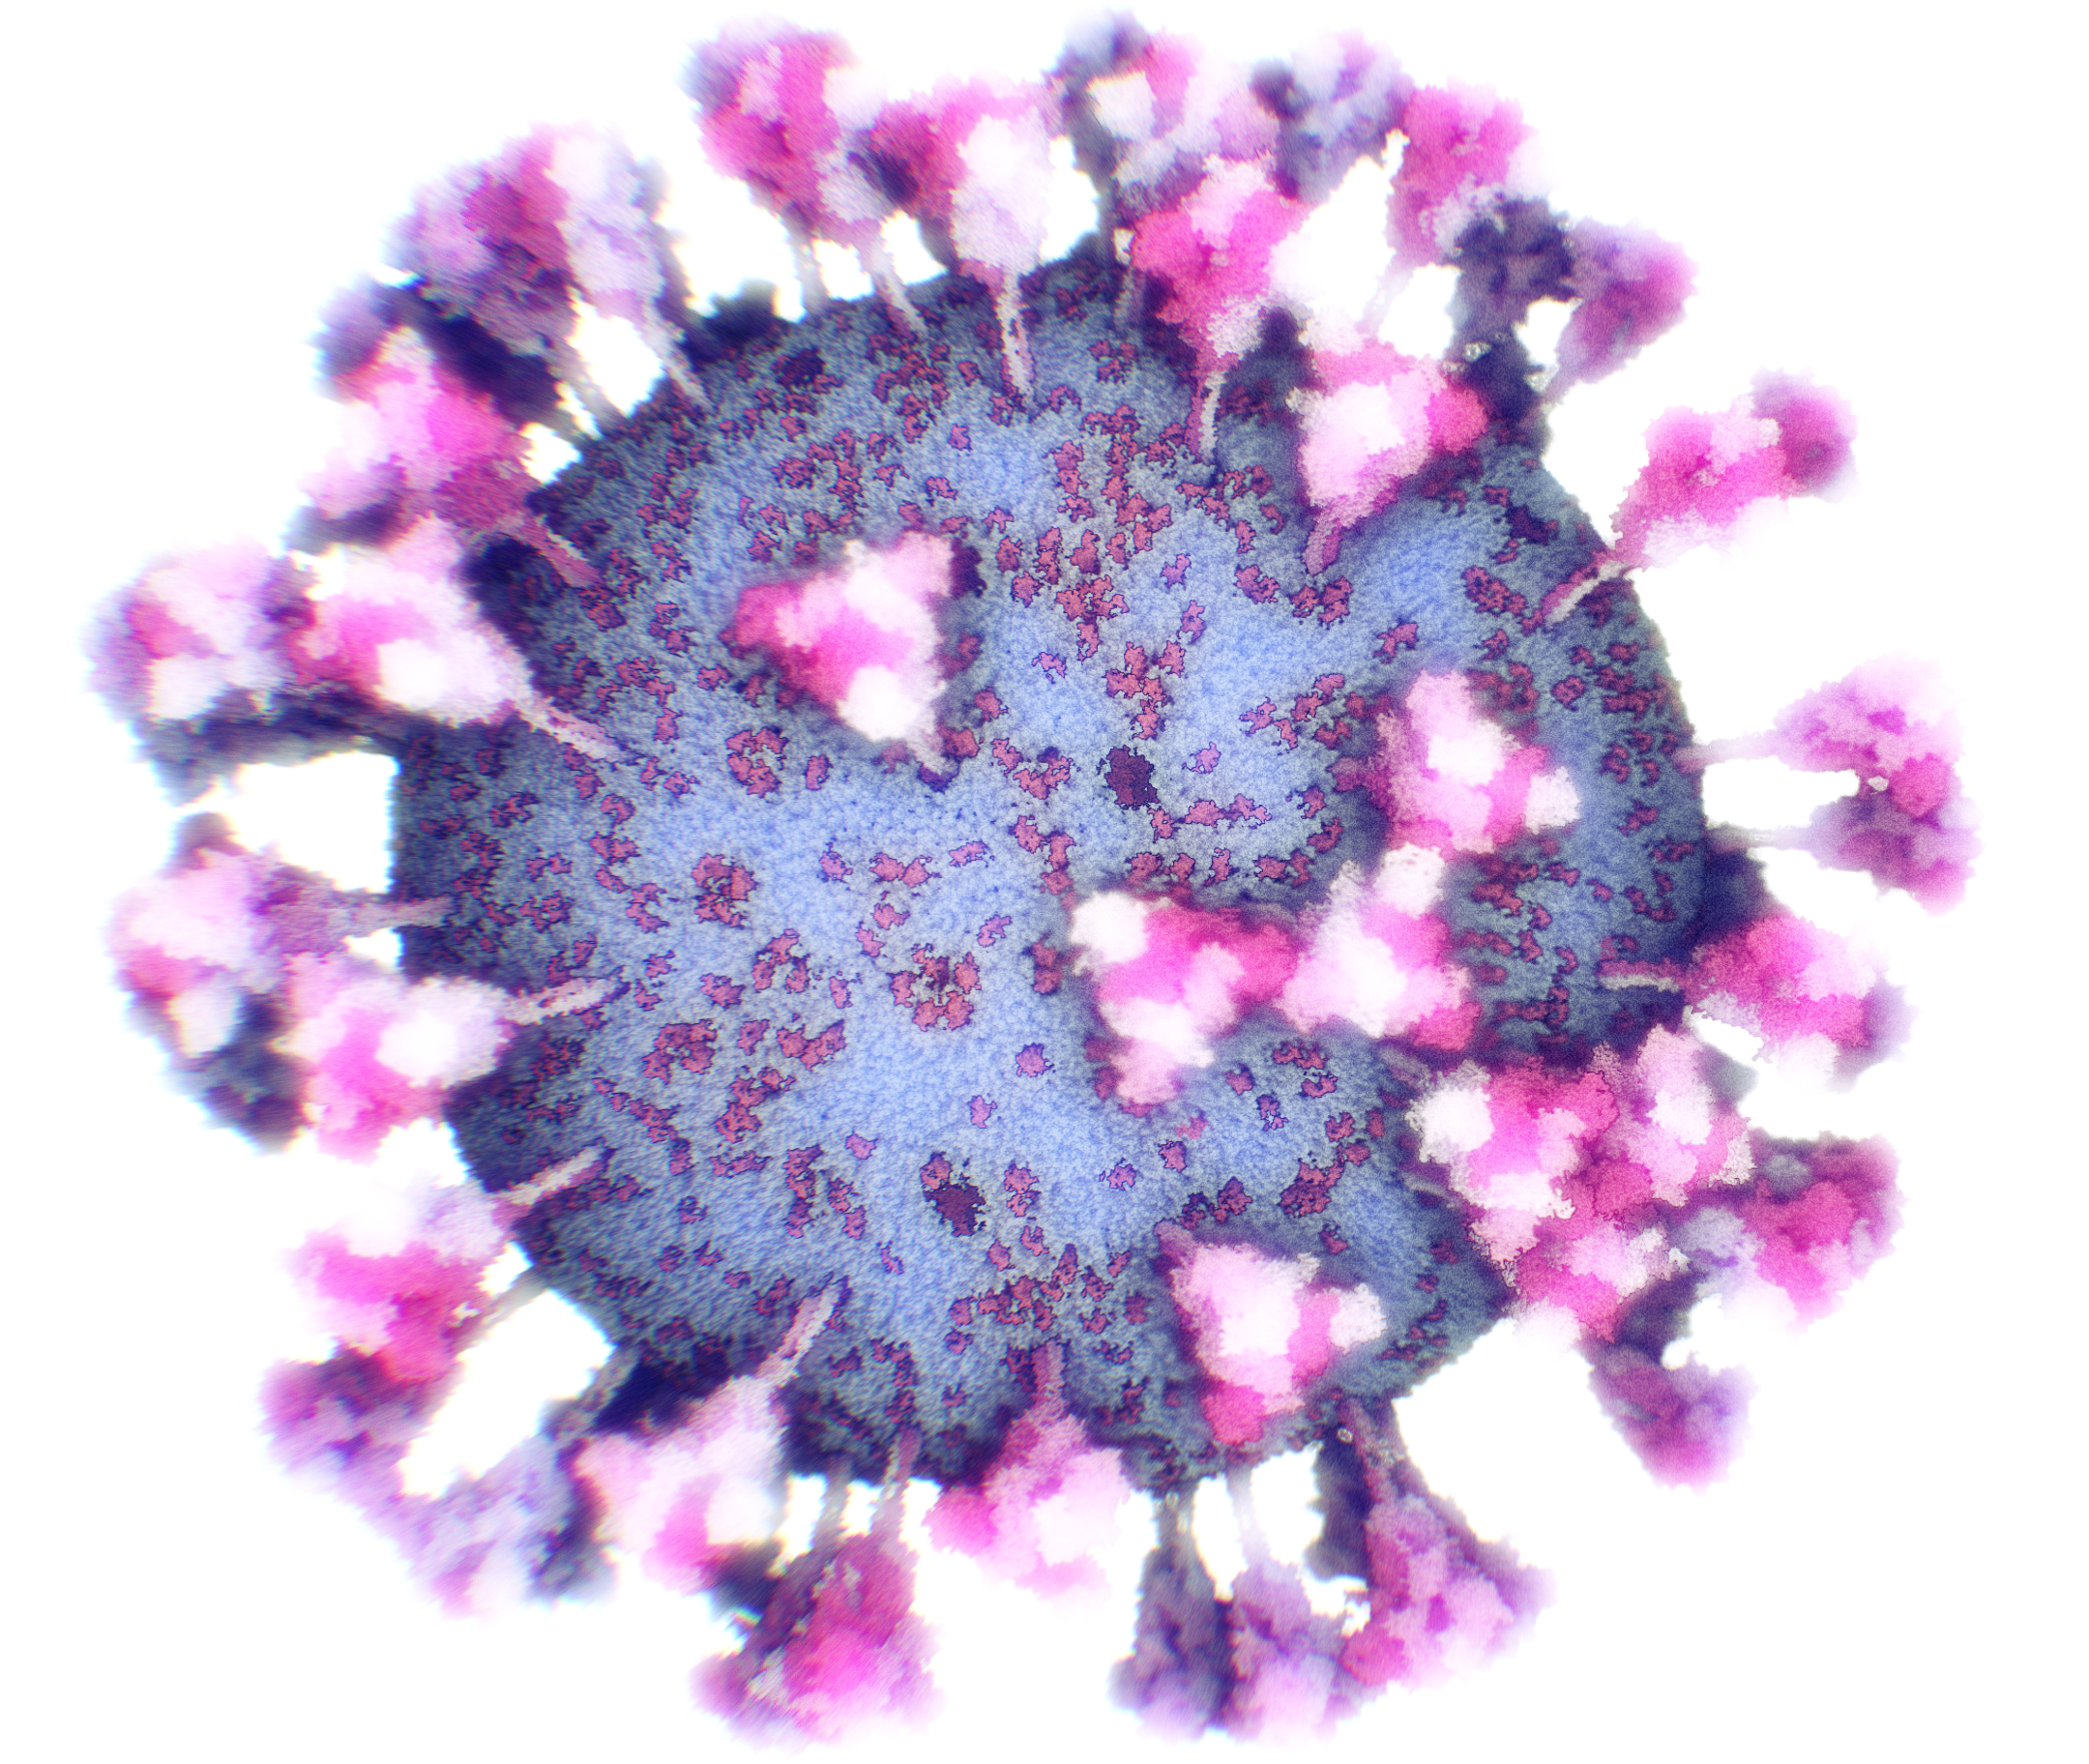
Modeling in the Time of COVID-19: Statistical and Rule-based Mesoscale Models
We present a new technique for the rapid modeling and construction of scientifically accurate mesoscale biological models...
Adenita: interactive 3D modelling and visualization of DNA nanostructures
The increasing complexity of novel applications requires significant computational support for the design, modelling and analysis of DNA nanostructures...
Homomorphic-Encrypted Volume Rendering
Some rendering tasks require the highest level of confidentiality so that no other party, besides the owner, can read or see the sensitive data...
Visual Abstraction
I. Viola, M. Chen, T. Isenberg
The concept of abstraction as it is used in visualization and put it on a solid formal footing ...
HyperLabels: Browsing of Dense and Hierarchical Molecular 3D Models
D. Kouril, T. Isenberg, B. Kozlikova, M. Meyer, M.E. Gröller, I. Viola
IEEE Transactions on Visualization and Computer Graphics
2019
Multi-Scale Procedural Animations of Microtubule Dynamics Based on Measured Data
T. Klein, I. Viola, M.E. Gröller, P. Mindek
IEEE Transactions on Visualization and Computer Graphics
Scale Trotter: Illustrative Visual Travels across Negative Scales
S. Halladjian, H. Miao, D. Kouril, M.E. Gröller, I. Viola, T. Isenberg
IEEE Transactions on Visualization and Computer Graphics
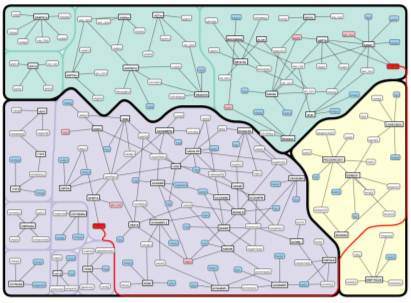
Metabopolis: Scalable Network Layout for Biological Pathway Diagrams in Urban Map Style
H.Y. Wu, M. Nöllenburg, F.L. Sousa, I. Viola
BMC Bioinformatics 20 (1), 187
Data-Driven Colormap Optimization for 2D Scalar Field Visualization
Q. Zeng, Y. Wang, J. Zhang, W. Zhang, C. Tu, I. Viola, Y. Wang
2019 IEEE Visualization Conference (VIS), 266-270
Parallel Generation and Visualization of Bacterial Genome Structures
T. Klein, P. Mindek, L. Autin, D.S. Goodsell, A.J. Olson, E.M. Gröller, I. Viola
Computer Graphics Forum 38 (7), 57-68
Multiscale Molecular Visualization
H. Miao, T. Klein, D. Kouřil, P. Mindek, K. Schatz, M.E. Gröller, B. Kozlíková, T. Isenberg, I. Viola
Journal of molecular biology 431 (6), 1049-1070
Cuttlefish: Color Mapping for Dynamic Multi‐Scale Visualizations
N. Waldin, M. Waldner, M. Le Muzic, E. Gröller, D.S. Goodsell, L. Autin, A.J. Olson, I. Viola
Computer Graphics Forum