Data-driven Colormap Adjustment for Exploring Spatial Variations in Scalar Fields
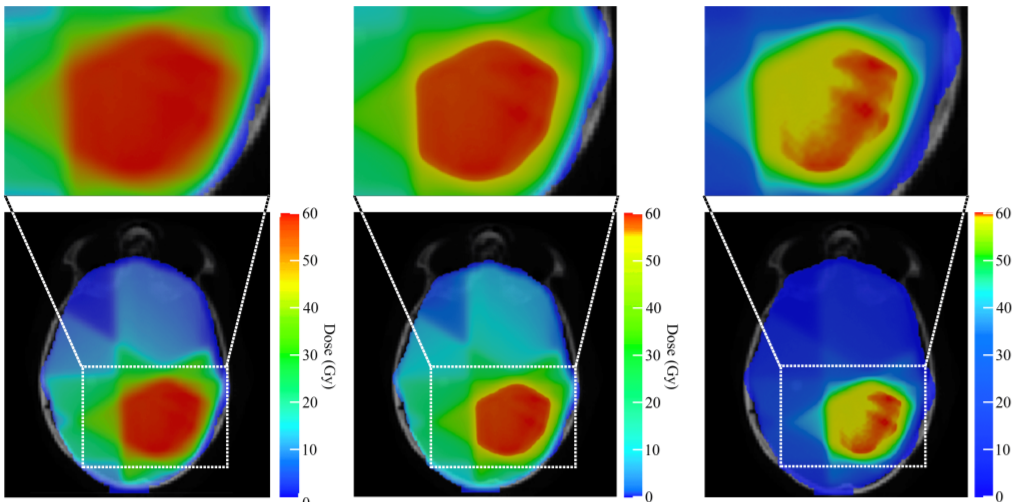
Radiotherapy dose data encoded by a rainbow colormap is shown in (left). Our optimized results before and after applying the ROI exploration tool are shown in (middle) and (right), respectively.
Authors
Qiong Zeng, Yongwei Zhao, Yinqiao Wang, Jian Zhang, Yi Cao, Changhe Tu, Ivan Viola, Yunhai Wang.Description
Colormapping is an effective and popular visualization technique for analyzing patterns in scalar fields. Scientists usually adjust a default colormap to show hidden patterns by shifting the colors in a trial-and-error process. To improve efficiency, efforts have been made to automate the colormap adjustment process based on data properties (e.g., statistical data value or distribution). However, as the data properties have no direct correlation to the spatial variations, previous methods may be insufficient to reveal the dynamic range of spatial variations hidden in the data. To address the above issues, we conduct a pilot analysis with domain experts and summarize three requirements for the colormap adjustment process. Based on the requirements, we formulate colormap adjustment as an objective function, composed of a boundary term and a fidelity term, which is flexible enough to support interactive functionalities. We compare our approach with alternative methods under a quantitative measure and a qualitative user study (25 participants), based on a set of data with broad distribution diversity. We further evaluate our approach via three case studies with six domain experts. Our method is not necessarily more optimal than alternative methods of revealing patterns, but rather is an additional color adjustment option for exploring data with a dynamic range of spatial variations.